Independent Metrics Module
Introduction
- APO is enabled by default and supports full collection of various types of observable data, including Trace, Metrics, and Logs. Users can flexibly configure the data collection types of APO-one-agent according to their own needs to adapt to the existing data types in their environment.
- APO monitoring Metrics data uses open-source components, which is no different from traditional Metrics data collection, and has a higher level of integration for rapid deployment.
- This document introduces how APO independently monitors Metrics data and explains how to configure APO to independently collect and monitor Metrics data.
Comparison with Traditional Methods
Traditional Metrics Data Collection: Mostly uses Prometheus Exporter for node metric collection, and if in a container environment, cAdvisor is added to collect container metrics. Prometheus then collects target node ports and stores the data. Grafana is used as the front-end to query metric data.
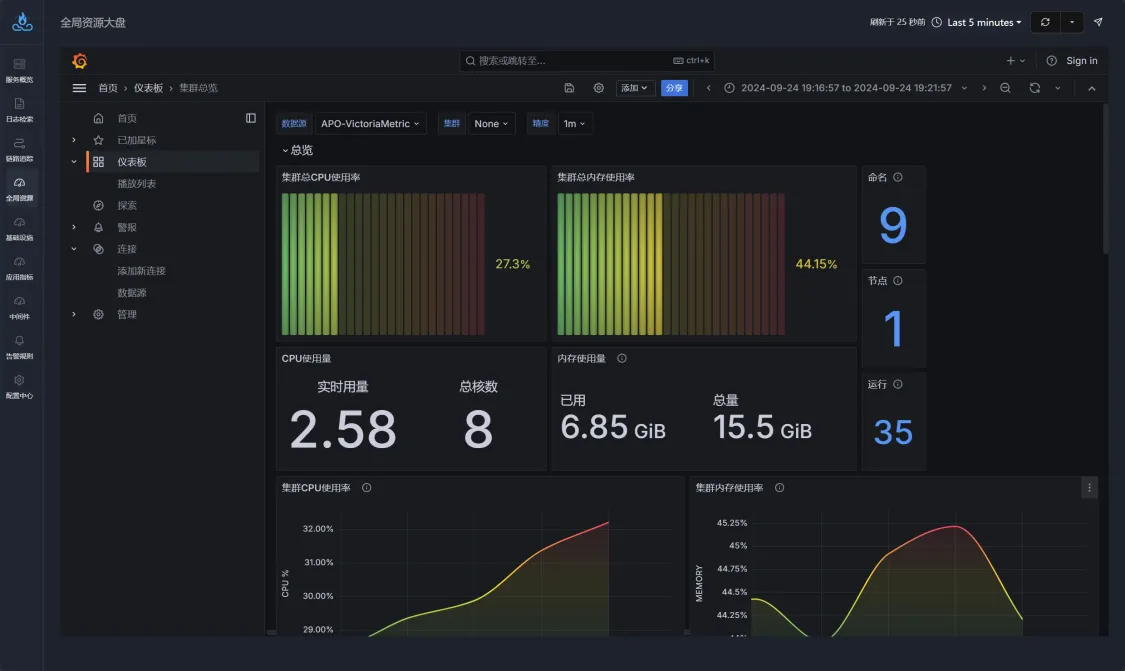
APO's Metrics Data Collection: Uses Grafana Alloy's exporter to collect metrics for nodes, containers, and Kubernetes environments, and pushes the data to VictoriaMetrics storage via OTEL Collector. The embedded Grafana in APO is used as the front-end to query and display metric data, with pre-configured dashboards for Kubernetes, containers, nodes, and network resource monitoring. All components are integrated into a single deployment, enabling rapid system setup and comprehensive monitoring coverage.
Implementation Principles
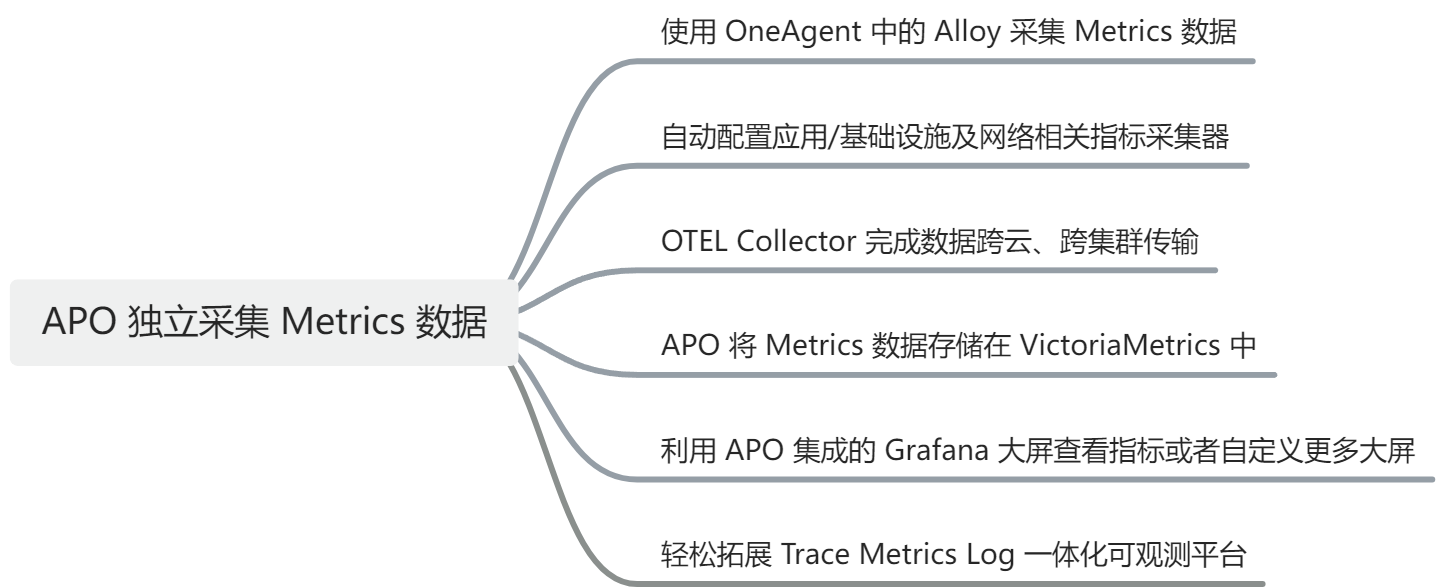
Using Alloy in OneAgent to Collect Metrics Data
Compared to the traditional Prometheus Node Exporter, APO-one-agent has built-in integration with Grafana Alloy, which can collect host node resource metrics, Kubernetes cluster information, and resource metrics for nodes and containers in a Kubernetes environment. Additionally, APO-one-agent integrates network components to collect key network performance metrics such as RTT (Round Trip Time) between nodes and containers.
Automatic Configuration of Application/Infrastructure and Network-Related Metric Collectors
Unlike traditional deployments where updating collectors requires maintaining configuration files to monitor target nodes and installing multiple collectors to meet your Metrics data collection needs, APO-one-agent requires only minimal configuration to obtain most of the commonly used metric data in production environments.
OTEL Collector for Cross-Cloud and Cross-Cluster Data Transmission
OTEL Collector is used to complete cross-cloud and cross-cluster data transmission. APO supports the OTEL protocol, and all Metrics data conforms to the OTEL data format, making it easy to be compatible with existing data sources and future expansions.
APO Stores Metrics Data in VictoriaMetrics
Compared to Prometheus, VictoriaMetrics is a more powerful metric storage database component, using fewer resources to store more data and achieve stronger performance. APO can optionally use the internally integrated VictoriaMetrics or easily connect to your existing VictoriaMetrics instance (specific configurations can be found in the production environment deployment recommendations).
View Metrics or Customize More Dashboards Using APO's Integrated Grafana
APO integrates Grafana and pre-configures multiple commonly used metric dashboards. You can query all Metrics data in Grafana, view APO's pre-configured metric dashboards, or customize more metric dashboards.
Effortlessly Expand to a Unified Observability Platform with Trace, Metrics, and Log
Compared to traditional Metrics monitoring systems, APO not only enables the collection of performance metrics for nodes, containers, and applications but also easily extends to a unified observability platform encompassing Trace, Metrics, and Log. Through this platform, different data types (such as metrics, traces, and logs) can be correlated, providing a comprehensive observability view that helps developers and operations teams to be more efficient in performance tuning, troubleshooting, and anomaly monitoring. APO builds a full-stack observability system in a one-stop manner, greatly simplifying system management and monitoring tasks.
How to Configure APO to Use Only the Metrics Monitoring Module
Step 1: Preparation
To install APO using Helm, ensure the following steps have been completed:
- Install a Kubernetes server on your computer. For information on installing Kubernetes, refer to Installing Kubernetes.
- Install the latest stable version of Helm. For information on installing Helm, refer to Installing Helm.
- Network Policy: Ensure that the cluster/machine where APO-one-agent is located can access ports 30044, 31363, 31317, and 30319 of the APO-server cluster.
Step 2: Set Up the APO Helm Repository
To set up the APO Helm repository to download the correct APO Helm charts on your computer, complete the following steps: Use the command below to add the apo Helm repository
helm repo add apo https://clouddetail.github.io/apo-helm-charts
helm repo update apo
Step 3: Configure APO Components for Independent Metrics Data Collection Mode
Create the file apo-values.yaml, define it according to your needs, and mount the configuration during the deployment phase.
This step configures the APO-server data mode to independently use the Metrics module data mode.
# apo-values.yaml

# agentCollectorMode is the data collection mode
global:
  agentCollectorMode:
    - metrics

# APO-server
# Persistence configuration, default is false
# Production environment: Recommended to enable
# POC phase: Non-persistent configuration can be used for quick deployment
# If persistent configuration is used, PV needs to be created according to PVC
altinity-clickhouse-operator:
  clickhouse:
    persistence:
      enabled: true
victoria-metrics-single:
  server:
    persistentVolume:
      enabled: true
apo-backend:
  persistence:
    enabled: true
The configuration provided here is the basic configuration for APO deployment. If you need to make more configuration changes, download the values.yaml file from the APO Helm Charts repository:
helm show values apo/apo > values.yaml
Step 4: Deploy APO-server
Run the following command to mount the configuration file and deploy.
helm install apo apo/apo -n apo --create-namespace \
-f apo-values.yaml
Step 5: Configure APO-one-agent to Use Only the Metrics Monitoring Module
Create the file apo-one-agent-values.yaml, define it according to your needs, and mount the configuration during the deployment phase.
This step configures the APO-one-agent data mode to independently use the Metrics module data mode.
# apo-one-agent-values.yaml
apoServerIP is the ClusterIP where APO-server is located
agentCollectorMode is the data collection mode
global: apoServerIP: x.x.x.x # FIXME agentCollectorMode:
- metrics
Here is the basic configuration provided for APO deployment. If you need to make more configuration changes, please download the `values.yaml` file from the APO Helm Charts repository:

```bash
helm show values apo/apo-one-agent > values.yaml
Step 6: Deploy APO-one-agent
Run the following command to mount the configuration file and deploy.
helm install apo-one-agent apo/apo-one-agent -n apo --create-namespace \
-f apo-one-agent-values.yaml
Step 7: Verification
Execute the following command to check the pod running status.
kubectl get po -n apo
Uninstall APO-server
kubectl delete clickhouseinstallation apo -napo
helm uninstall apo -n apo
kubectl delete ns apo
Uninstall APO-one-agent
helm uninstall apo-one-agent -n apo
kubectl delete ns apo