Independent Trace Module
Introduction
- APO-one-agent is enabled by default and supports comprehensive collection of various types of observability data, including Trace, Metrics, and Logs. Users can flexibly configure the data collection scope of APO-one-agent to adapt to the existing data types in their environment.
- Compared to traditional Trace data collection and monitoring, APO's Trace data monitoring can automatically inject Trace configurations into applications, offering higher integration and compatibility, and enabling rapid deployment.
- This document explains how APO independently monitors Trace data and provides guidance on configuring APO to independently collect and monitor Trace data.
Comparison with Traditional Methods
Traditional Trace Data Collection: Currently, the two most popular Trace systems—Skywalking and Opentelemetry—require manual configuration of Trace probes for Java applications, deployment of Skywalking or OTEL collectors, and finally importing data into ElasticSearch for querying. Configuring Trace probes for applications is cumbersome, and probe updates are difficult to synchronize. Additionally, ElasticSearch consumes significant resources and incurs high costs.
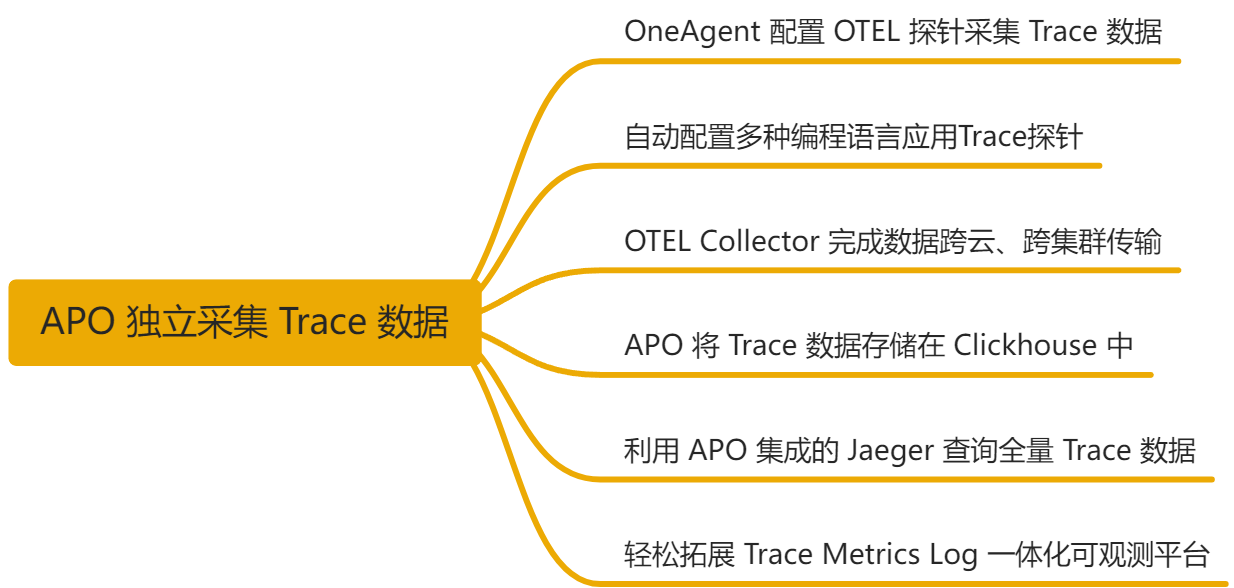
APO's Trace Data Collection: Using OneAgent's automatic injection solution, APO automatically injects the corresponding environment variables and Trace probe files into applications. Simply restarting the application completes the injection. APO is compatible with both Skywalking and Opentelemetry data formats, sending all Trace data to the OTEL Collector for conversion before pushing it to the Jaeger Collector for storage in Clickhouse. APO automatically calculates and aggregates Trace information, embedding Jaeger UI for querying full Trace data. All components are integrated into a single deployment, enabling rapid system setup and comprehensive monitoring coverage.
Implementation Principles
OneAgent Configures OTEL Probes to Collect Trace Data
After an application generates Trace data, it transmits the data to the OTEL Collector Agent within the APO-one-agent on the current node. It also supports redirecting existing application probes' OAP addresses to APO for use and correlation with other data. The data is automatically converted into the OTEL format in the OTEL Collector and pushed to the server-side Jaeger storage.
Automatic Configuration of Trace Probes for Multiple Programming Languages
Compared to traditional Trace data collection, APO-one-agent adopts an automatic configuration approach, using Odiglet to inject the necessary configurations and files for Trace data collection into the target services.
APO-one-agent's automatic probe injection defaults to using popular OTEL open-source probe solutions:
- Java agent: opentelemetry-java-instrumentation v2.8.0
- Python agent: opentelemetry-python 1.23.0/0.44b0
- NodeJs agent: opentelemetry-js v1.24.1/0.51.1
- Go agent: Grafana Beyla v1.8.4
If you are already using Skywalking or OTEL application probes for data collection, we also support packaging APO-one-agent with custom probe image versions.
OTEL Collector Enables Cross-Cloud, Cross-Cluster Data Transmission
By leveraging the OTEL Collector, APO achieves efficient data transmission across multi-cloud and multi-cluster environments. As the core component of OpenTelemetry for data collection and transmission, the OTEL Collector supports multiple protocols and transmission modes, ensuring reliable collection and delivery of data to centralized storage or monitoring platforms, regardless of the data source's location. This architecture significantly enhances system flexibility in multi-cloud and hybrid cloud environments, eliminating data silos between different cloud providers or clusters.
APO Stores Trace Data in ClickHouse
ClickHouse, a high-performance columnar storage database, outperforms ElasticSearch in handling high-throughput writes and complex query operations. Thanks to its columnar storage architecture, ClickHouse significantly boosts query speeds when dealing with large-scale data analysis, especially excelling in operations like aggregation and filtering. It also consumes less storage space for the same data volume, further reducing resource usage. APO also supports importing data into existing ClickHouse instances. For specific configurations, please refer to the production environment deployment recommendations.
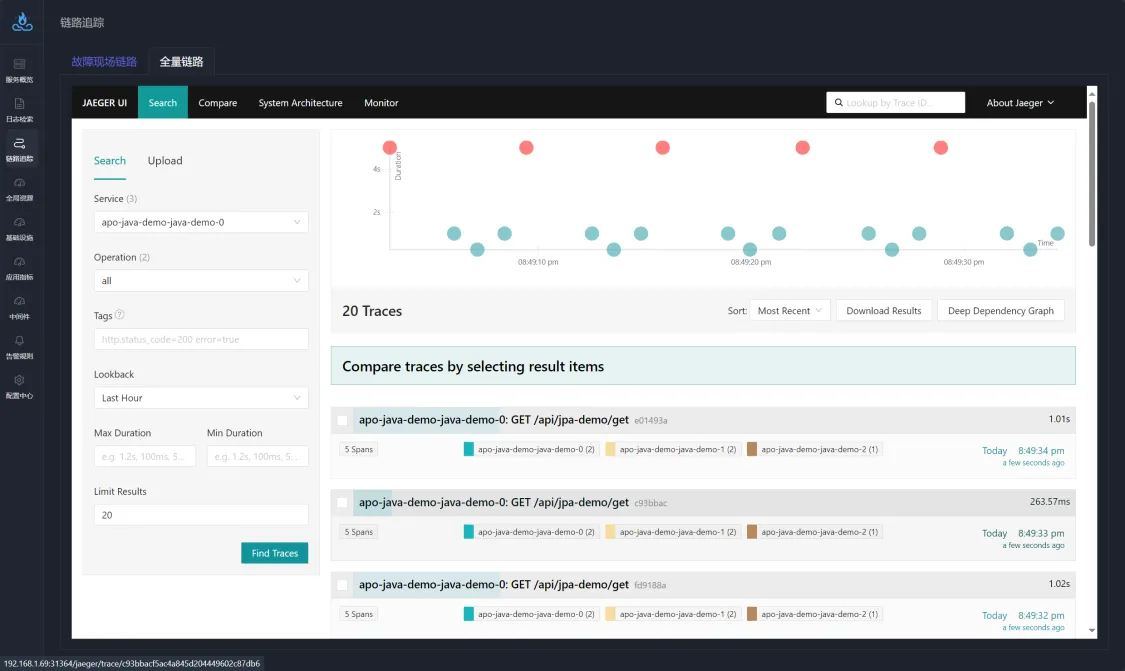
Query Full Trace Data Using APO's Integrated Jaeger
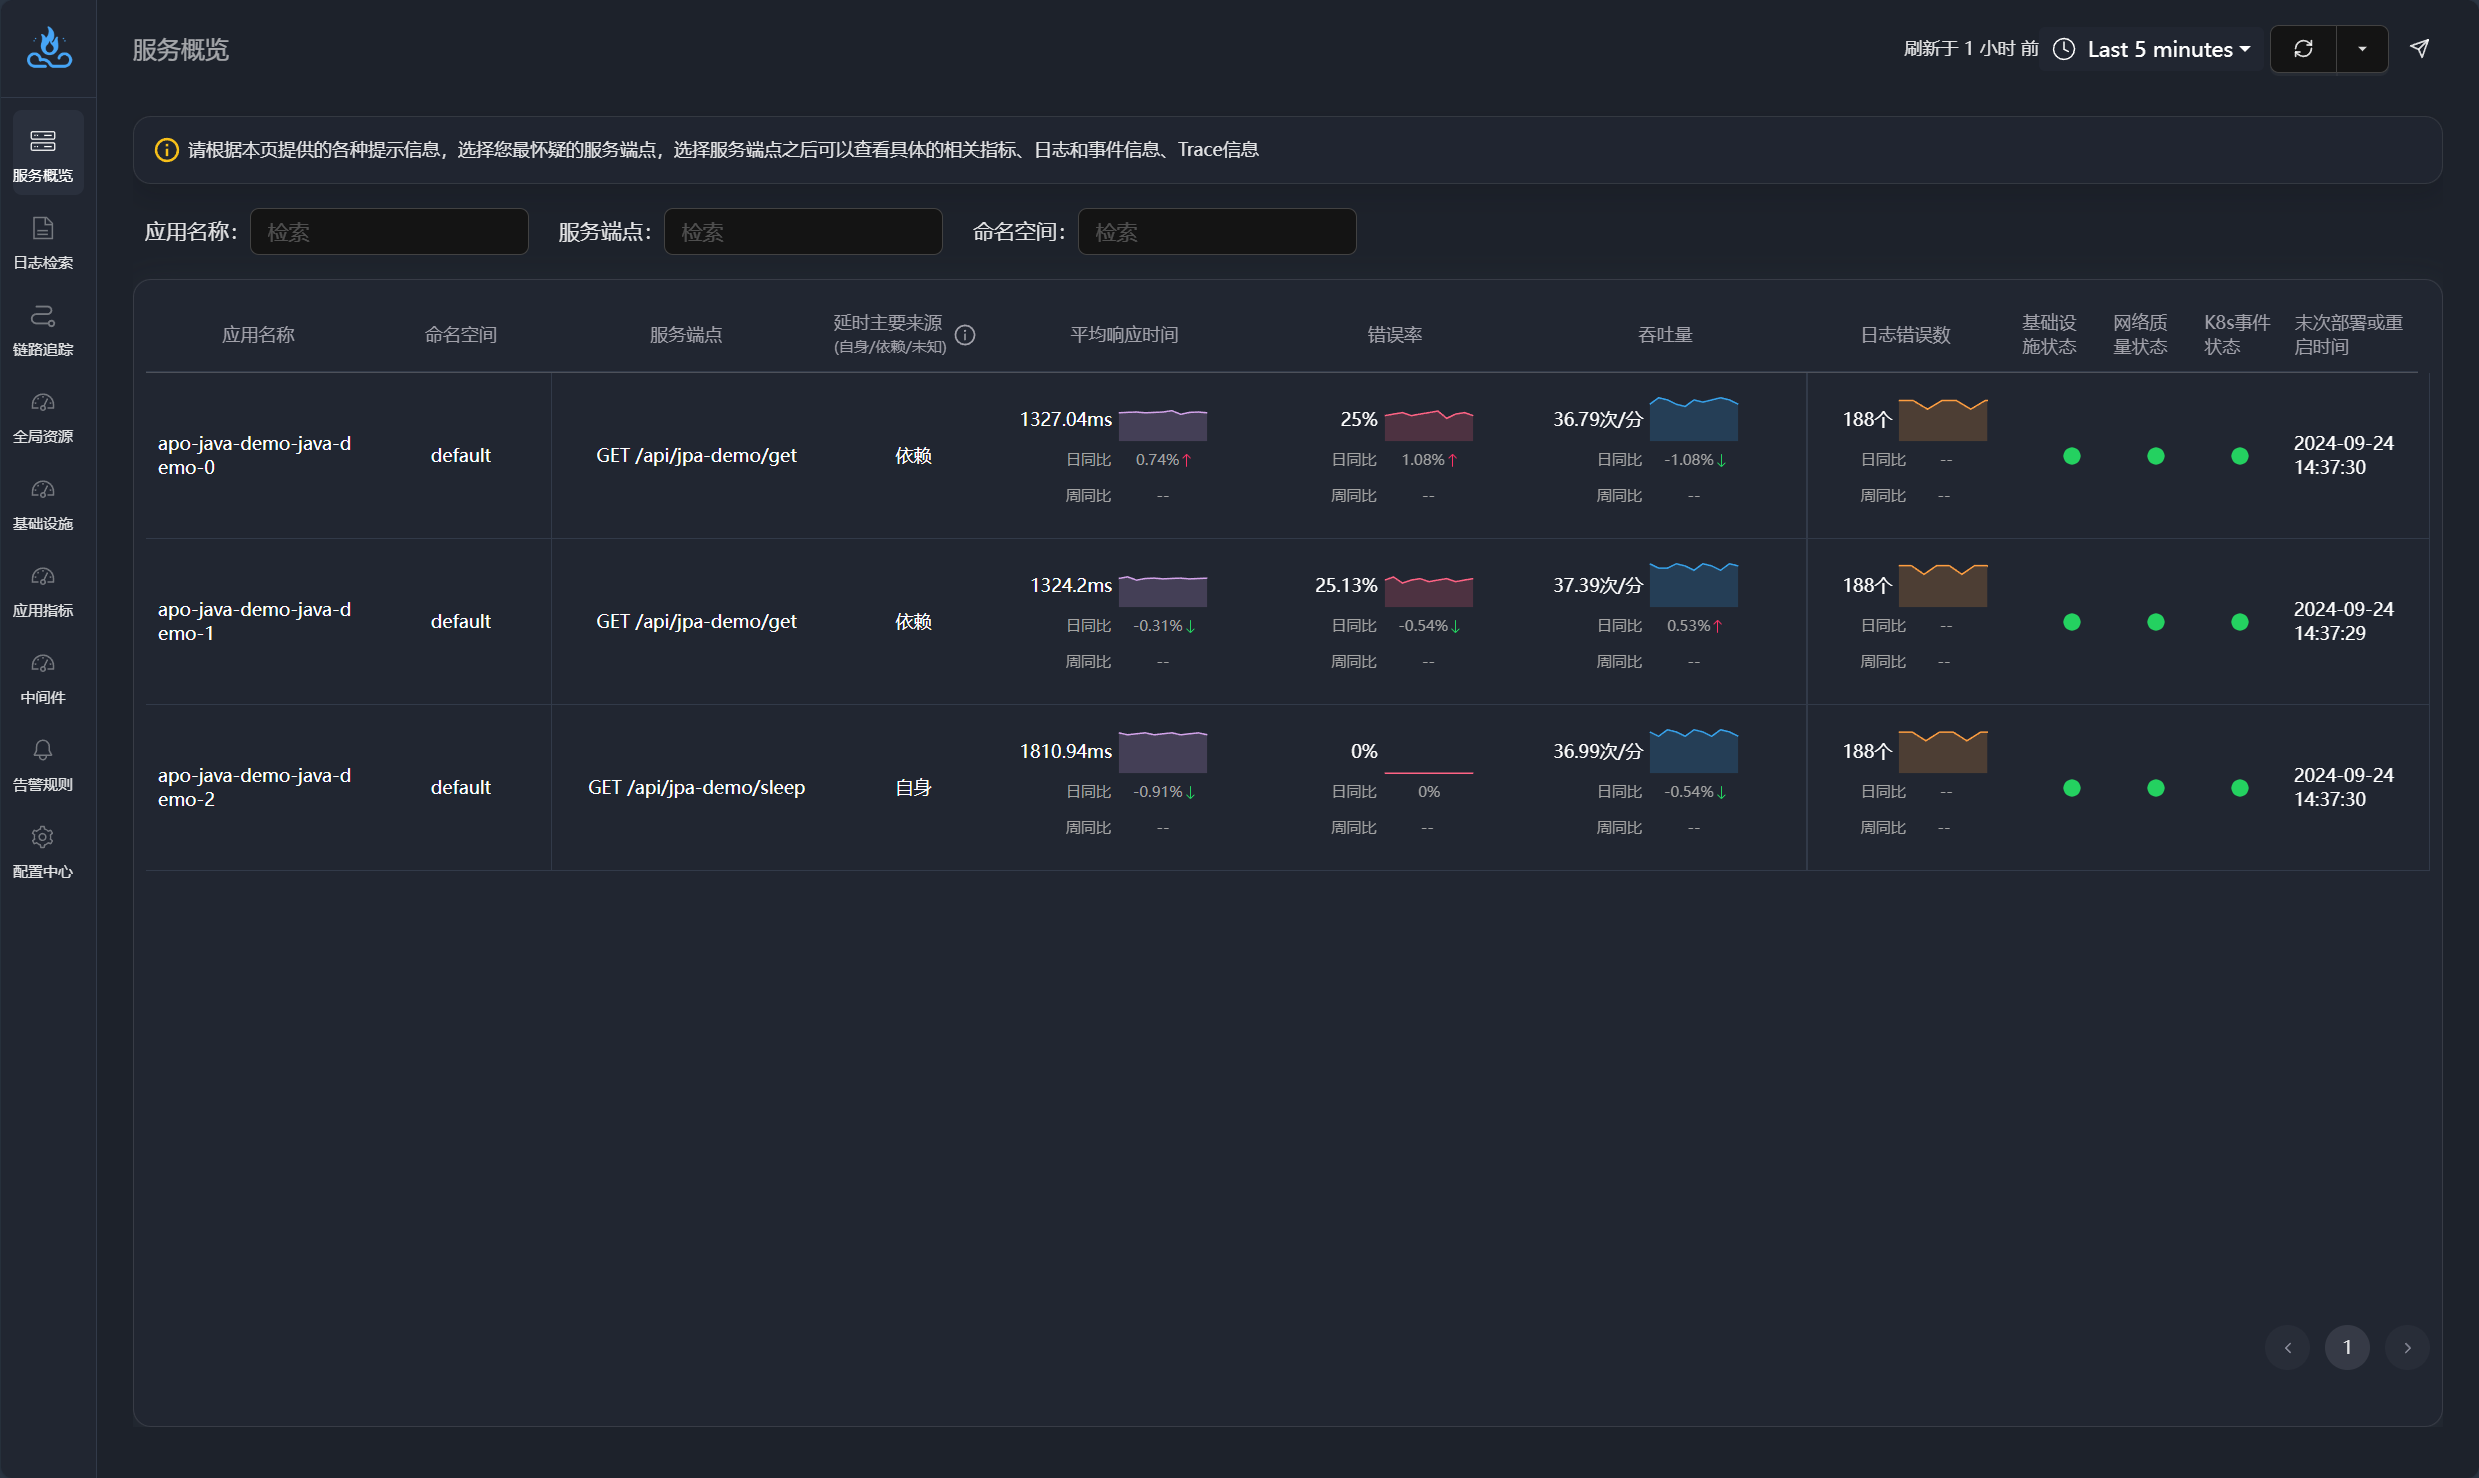
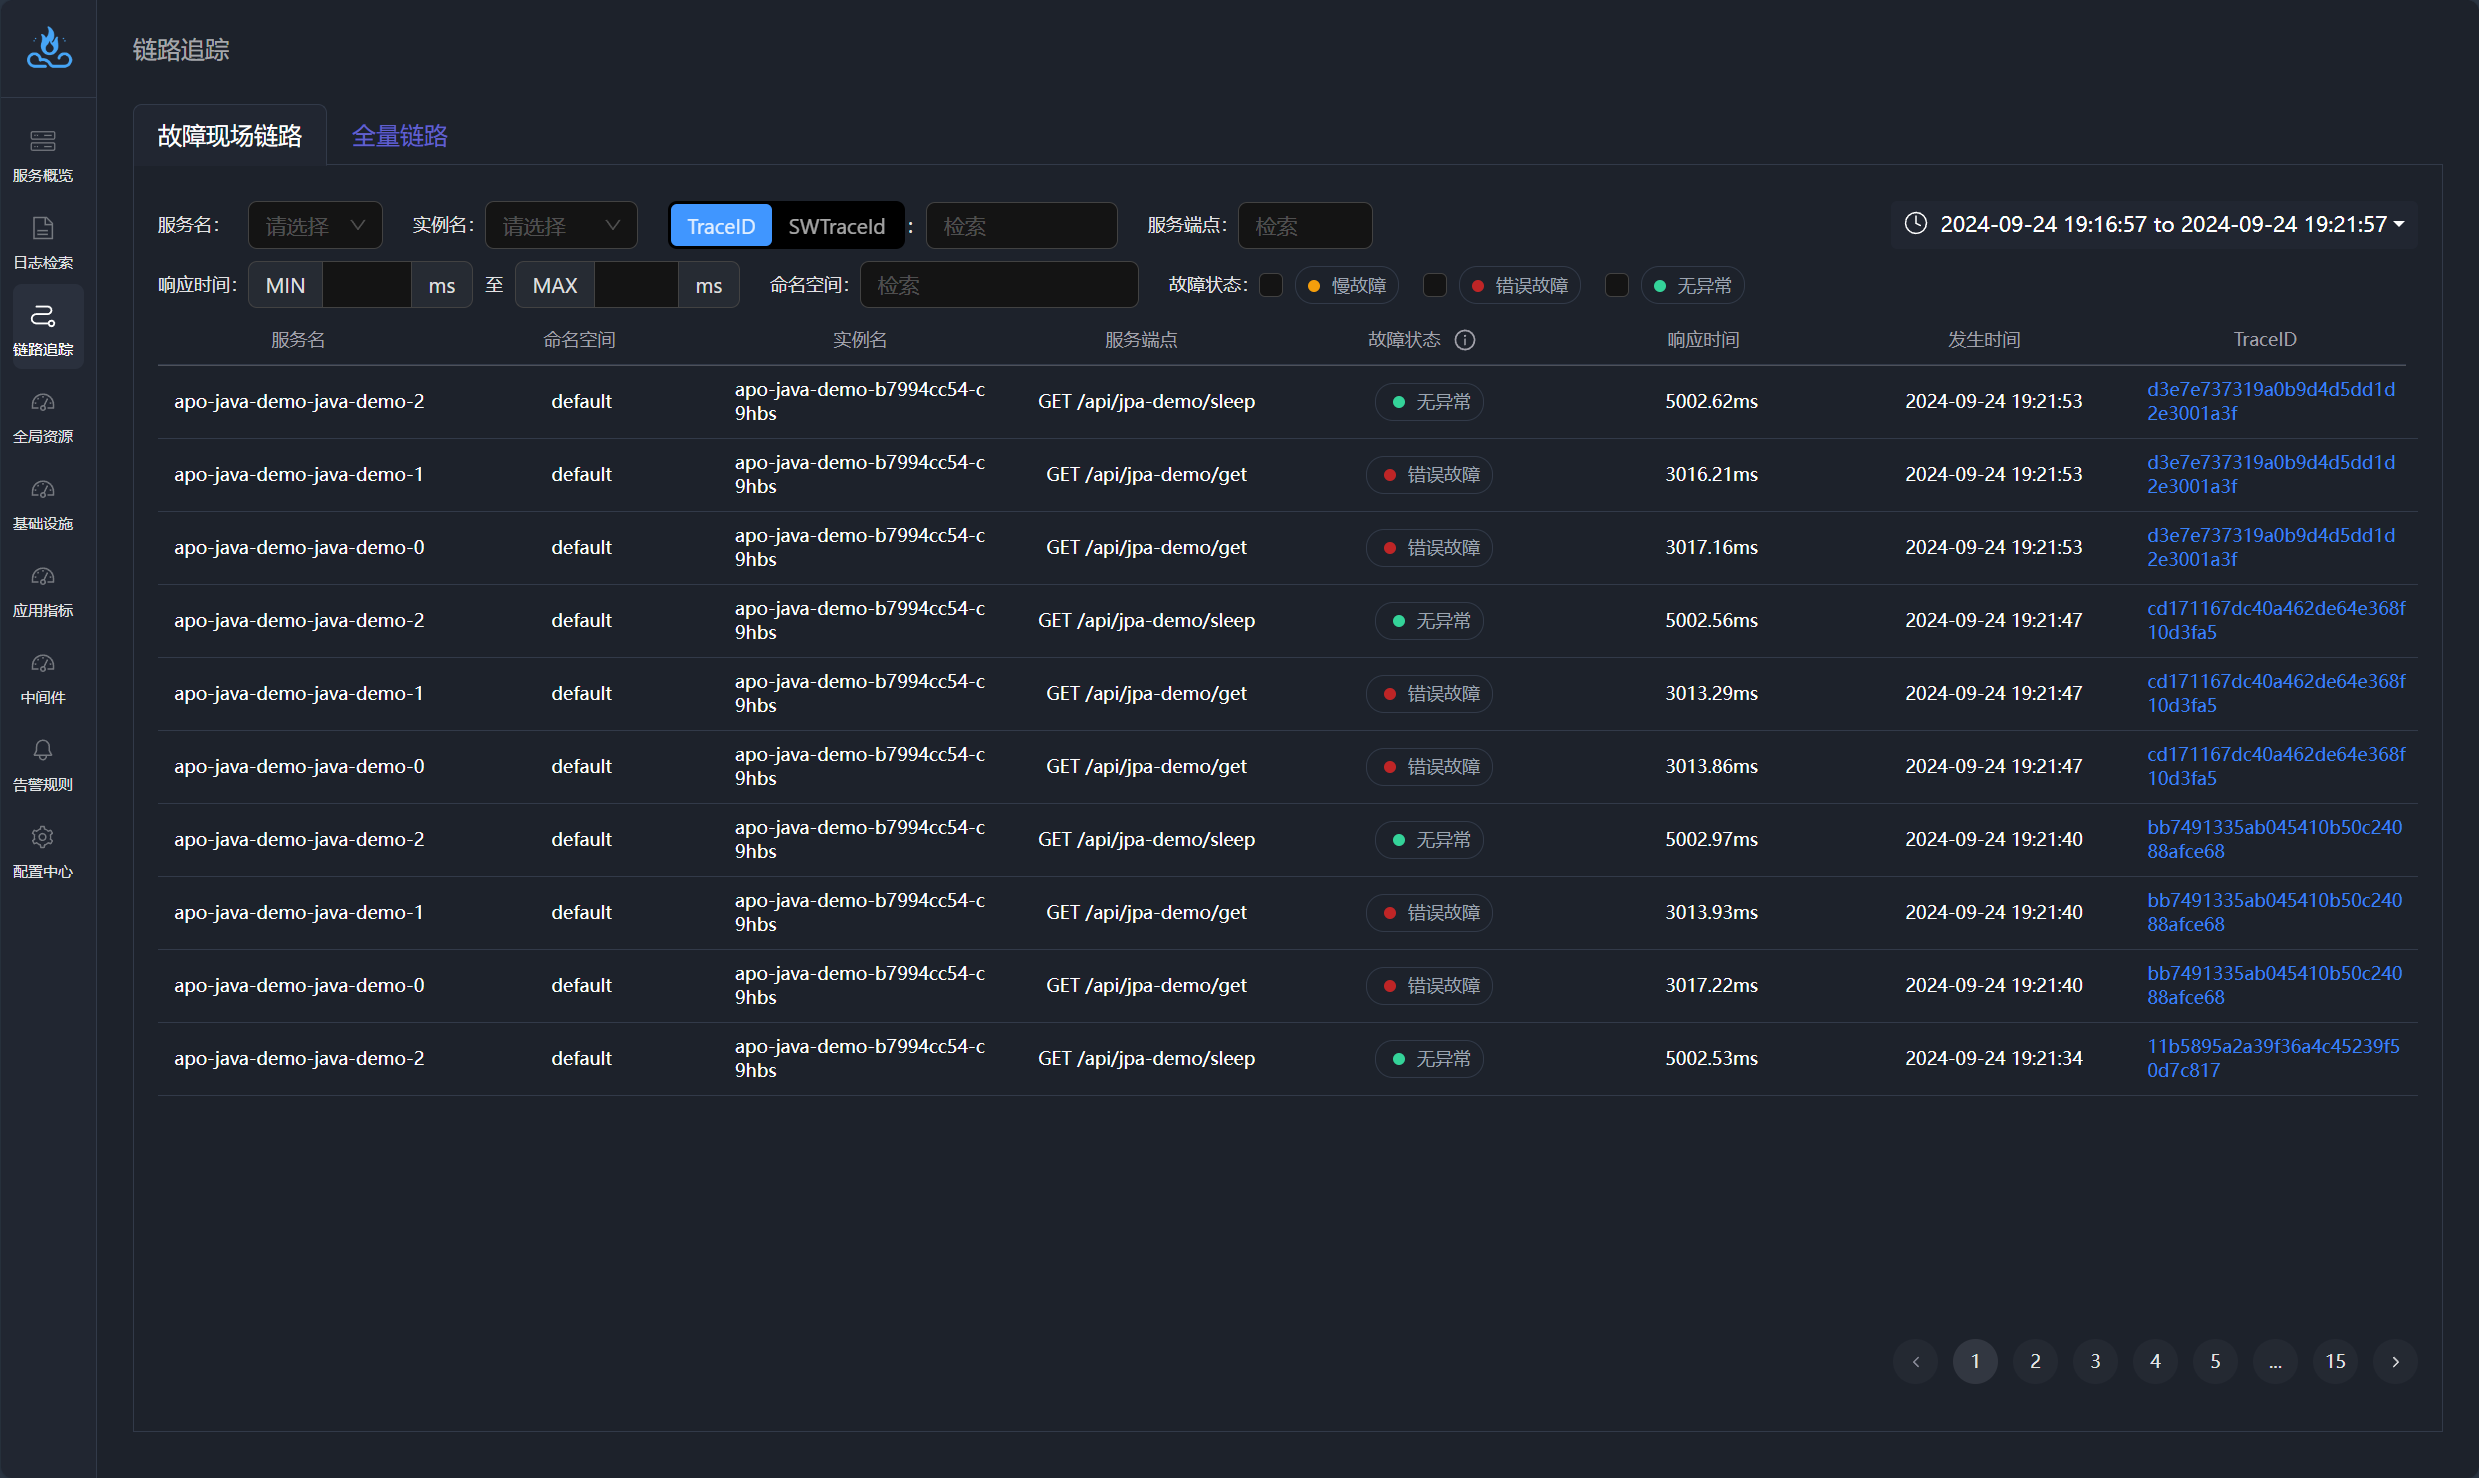
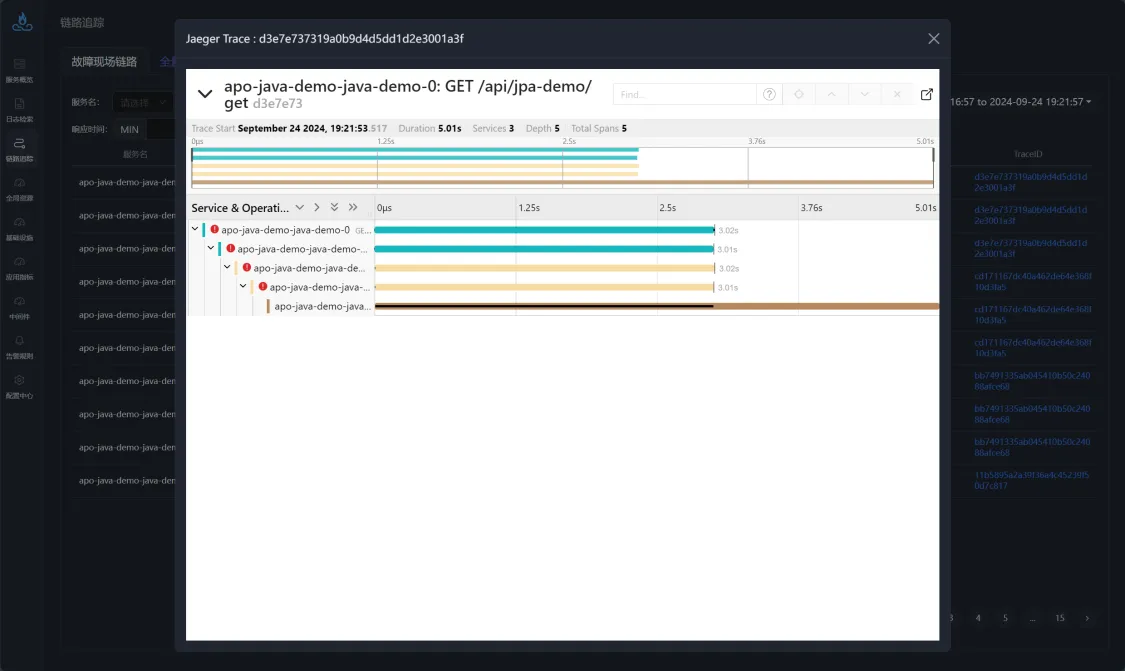
The APO platform comes with built-in trace data analysis, enabling statistics on application interface metrics such as average response time, error rate, and throughput, with daily and weekly comparisons. In the event of a failure, it provides detailed instance information and associates it with the fault trace. APO also offers full trace data retrieval capabilities, allowing quick filtering of trace data for delayed or erroneous requests. Additionally, the platform includes a built-in Jaeger UI for comprehensive trace data queries.
Easily Expand to a Unified Observability Platform for Trace, Metrics, and Logs
Compared to traditional trace monitoring systems, APO not only automatically injects trace configurations for applications but also easily extends to a unified observability platform covering Trace, Metrics, and Logs. This platform allows different data types (such as metrics, traces, and logs) to correlate with each other, providing a complete observability view. This helps developers and operations teams perform performance tuning, fault diagnosis, and anomaly monitoring more efficiently. APO builds a full-stack observability system in a one-stop manner, greatly simplifying system management and monitoring tasks.
How to Configure APO to Use Only the Trace Monitoring Module
Step 1: Preparation
To install APO using Helm, ensure the following steps are completed:
- Install a Kubernetes server on your computer. For information on installing Kubernetes, refer to Installing Kubernetes.
- Install the latest stable version of Helm. For information on installing Helm, refer to Installing Helm.
- Network Policy: Ensure the cluster/machine where APO-one-agent resides can access ports 30044, 31363, 31317, and 30319 of the APO-server cluster.
Step 2: Set Up the APO Helm Repository
To set up the APO Helm repository for downloading the correct APO Helm charts on your computer, complete the following steps: Use the command below to add the apo Helm repository
helm repo add apo https://clouddetail.github.io/apo-helm-charts
helm repo update apo
Step 3: Configure APO Components for Independent Trace Data Collection Mode
Create a file named apo-values.yaml, define it according to your requirements, and mount the configuration during deployment.
This step configures the APO-server data mode to independently use the Trace module data mode.
# apo-values.yaml
# agentCollectorMode is the data collection mode
global:
  agentCollectorMode:
    - trace

# APO-server
# Persistence configuration, default is false
# Production environment: Recommended to enable
# POC phase: Non-persistent configuration can be used for quick deployment
# If persistence is enabled, PV needs to be created based on PVC
altinity-clickhouse-operator:
  clickhouse:
    persistence:
      enabled: true
victoria-metrics-single:
  server:
    persistentVolume:
      enabled: true
apo-backend:
  persistence:
    enabled: true
The provided configuration is the basic setup for APO deployment. If you need to make more configuration changes, please download the values.yaml file from the APO Helm Charts repository:
helm show values apo/apo > values.yaml
Step 4: Deploy APO-server
Run the following command to mount the configuration file and deploy.
helm install apo apo/apo -n apo --create-namespace \
-f apo-values.yaml
Step 5: Configure APO-one-agent to use only the Trace monitoring module
Create the file apo-one-agent-values.yaml, define it according to your needs, and mount the configuration during the deployment phase.
This step configures the APO-one-agent data mode to independently use the Trace module data mode.
# apo-one-agent-values.yaml

# apoServerIP is the ClusterIP where APO-server is located
# agentCollectorMode is the data collection mode
global:
  apoServerIP: x.x.x.x # FIXME
  agentCollectorMode:
    - trace
The provided configuration is the basic setup for APO deployment. If you need to make more configuration changes, please download the values.yaml file from the APO Helm Charts repository:
helm show values apo/apo-one-agent > values.yaml
Step 6: Deploy APO-one-agent
Run the following command to mount the configuration file and deploy.
helm install apo-one-agent apo/apo-one-agent -n apo --create-namespace \
-f apo-one-agent-values.yaml
Step 7: Verification
Execute the following command to check the pod running status.
kubectl get po -n apo
Uninstall APO-server
kubectl delete clickhouseinstallation apo -napo
helm uninstall apo -n apo
kubectl delete ns apo
Uninstall APO-one-agent
helm uninstall apo-one-agent -n apo
kubectl delete ns apo